Containerization-and-DevOps
Experiment 5: Docker – Volumes, Environment Variables, Monitoring & Networks
### Name – Siddharth Negi
Batch - B3
Sap_id - 500121910
Roll_no - R2142231376
1. Aim
The aim of this experiment is to develop a comprehensive understanding of advanced Docker features used in real-world containerized application development:
- Implement Docker Volumes for persistent data storage across container lifecycles.
- Configure and use Environment Variables to dynamically configure containerized applications.
- Apply Docker Monitoring commands to observe container health and resource usage.
- Create and manage Docker Networks to enable secure inter-container communication.
- Integrate all the above concepts to deploy a multi-container application stack (Flask + PostgreSQL + Redis).
2. Theory
2.1 Docker Volumes
By default, Docker containers are ephemeral — any data written inside a container is lost when the container stops or is removed. Docker Volumes solve this problem by providing a mechanism to persist data outside the container’s writable layer.
Docker supports three types of storage mounts:
- Anonymous Volumes — Automatically created with a random hash name. Tied to the container’s lifecycle and managed by Docker.
- Named Volumes — Explicitly named volumes that survive container deletion. Best practice for production databases and stateful services.
- Bind Mounts — A specific directory on the host machine is mounted into the container. Useful for development where real-time code changes need to be reflected instantly.
2.2 Environment Variables
Environment variables are key-value pairs that allow dynamic configuration of containerized applications without modifying the application’s source code or Docker image. They follow the Twelve-Factor App methodology for building portable, scalable software.
They can be passed to containers in three ways:
- Using the
-eflag inline in thedocker runcommand. - Using the
--env-fileflag pointing to a.envconfiguration file. - Defined in the Dockerfile using the
ENVinstruction (sets defaults that can be overridden at runtime).
2.3 Docker Monitoring
Monitoring containerized applications is critical for ensuring performance, availability, and debugging issues. Docker provides built-in monitoring tools:
docker stats— Real-time CPU, memory, network I/O, and block I/O usage for running containers.docker logs— View container stdout/stderr output, with filtering by time and line count.docker top— Lists all running processes inside a specific container.docker inspect— Returns detailed JSON configuration about a container including network settings, mounts, and environment variables.docker events— Streams real-time Docker daemon events such as container start, stop, die, and more.
2.4 Docker Networks
Docker Networks allow containers to communicate with each other and with external systems in a controlled, isolated manner. Docker provides several built-in network drivers:
- Bridge Network (Default) — Each container gets its own IP on a virtual switch. Containers on the same custom bridge network can communicate using container names as hostnames via Docker’s built-in DNS.
- Host Network — The container shares the host machine’s network stack directly. No network isolation. Best for performance-critical scenarios.
- None Network — Completely disables networking for the container. Only a loopback interface is present. Used for fully isolated, security-sensitive workloads.
- Overlay Network — Used in Docker Swarm for multi-host networking, allowing containers on different physical/virtual machines to communicate.
Part 1: Docker Volumes – Persistent Data Storage
Lab 1: Understanding Data Persistence
This lab demonstrates the ephemeral nature of container storage and the necessity of volumes.
Code
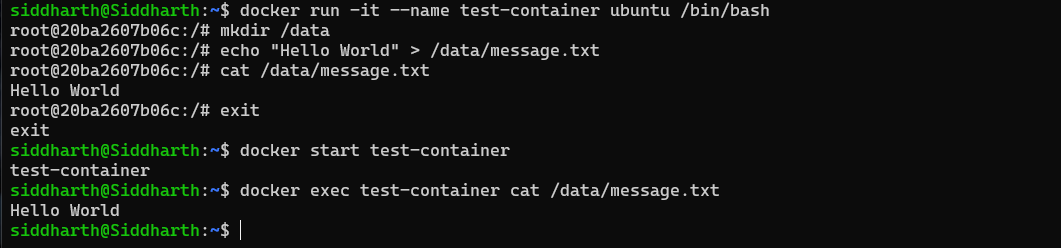
# Step 1: Create a container and write data to it
docker run -it --name test-container ubuntu /bin/bash

# Inside the container, run:
echo "Hello World" > /data/message.txt
cat /data/message.txt          # Output: Hello World
exit

# Step 2: Restart the container and try to read the file
docker start test-container
docker exec test-container cat /data/message.txt
# ERROR: No such file or directory — data was lost!
Explanation
When a container is removed and recreated, the writable layer is reset. The file written to /data/message.txt existed only in the container’s temporary layer and was not persisted anywhere on the host. This demonstrates why volumes are essential for any stateful workload such as databases, file uploads, or log files.
Lab 2: Volume Types
Anonymous Volumes
# Create a container with an anonymous volume
docker run -d -v /app/data --name web1 nginx

# View auto-generated volume name (random hash)
docker volume ls

# Inspect the container's mount configuration
docker inspect web1 | grep -A 5 Mounts
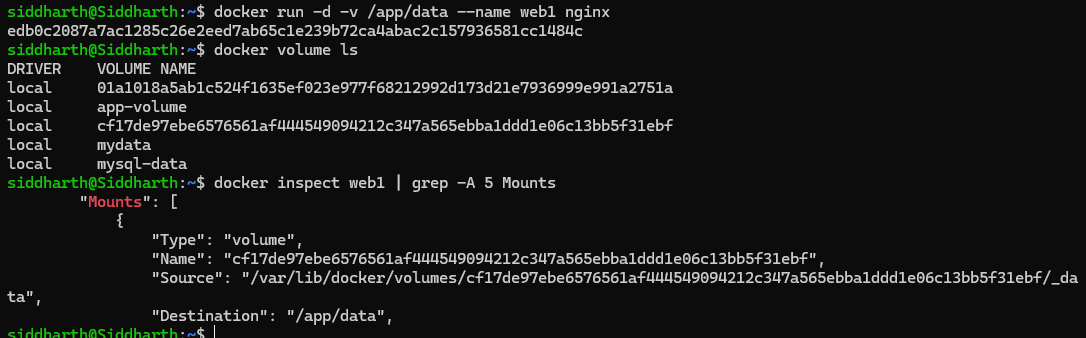
Explanation: An anonymous volume is created automatically by Docker and assigned a random UUID-based name. It is tied to the container lifecycle and is harder to reuse across containers.
Named Volumes
# Explicitly create a named volume
docker volume create mydata

# Mount the named volume to a container
docker run -d -v mydata:/app/data --name web2 nginx

# List volumes — 'mydata' will appear
docker volume ls

# Inspect volume metadata and mount path
docker volume inspect mydata
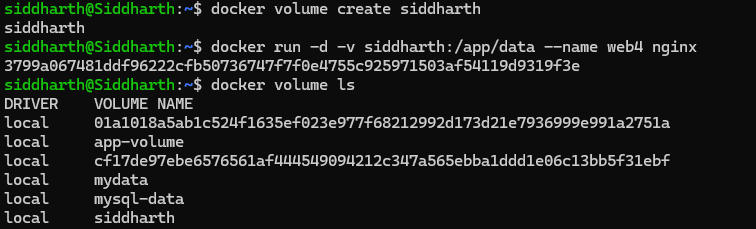
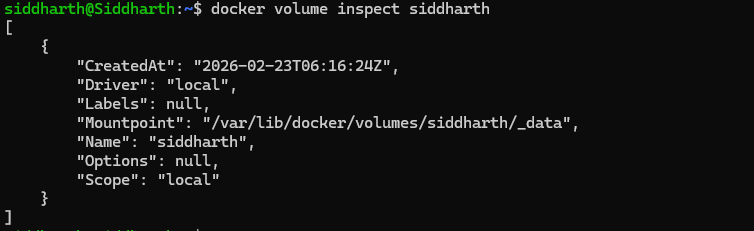
Explanation: Named volumes are the recommended approach for production. They persist even after the container is removed, and can be mounted to a new container to preserve data.
Bind Mounts
# Create a directory on the host machine
mkdir ~/myapp-data

# Run a container mounting the host directory
docker run -d -v ~/myapp-data:/app/data --name web3 nginx

# Create a file on the host
echo "From Host" > ~/myapp-data/host-file.txt

# Read the file from inside the container
docker exec web3 cat /app/data/host-file.txt
# Output: From Host
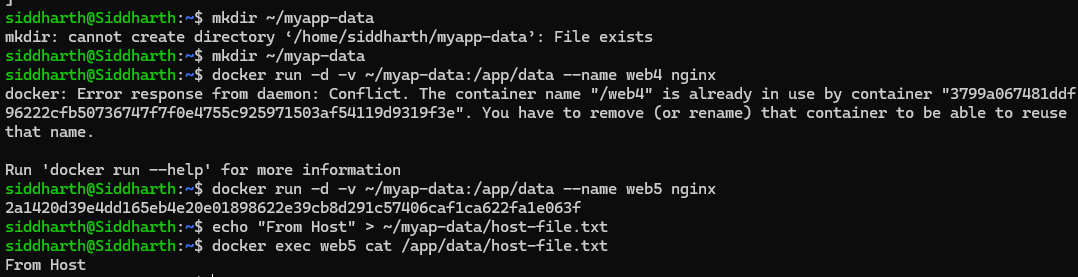
Explanation: Bind mounts directly map a host path to a container path. Any changes made on the host are immediately visible inside the container and vice versa. This is ideal for local development workflows where source code changes should reflect instantly without rebuilding the image.
Lab 3: Practical Volume Examples
Example 1 – MySQL Database with Persistent Storage
# Launch MySQL with a named volume for data persistence
docker run -d \
  --name mysql-db \
  -v mysql-data:/var/lib/mysql \
  -e MYSQL_ROOT_PASSWORD=secret \
  mysql:8.0

# Stop and delete the original container
docker stop mysql-db
docker rm mysql-db

# Create a new MySQL container reusing the same volume
docker run -d \
  --name new-mysql \
  -v mysql-data:/var/lib/mysql \
  -e MYSQL_ROOT_PASSWORD=secret \
  mysql:8.0
# All previous database data is intact!
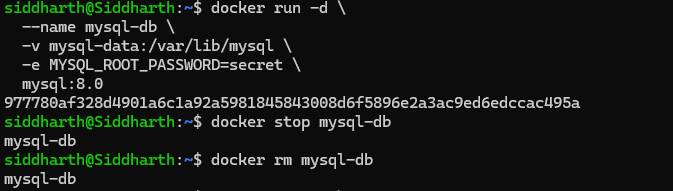
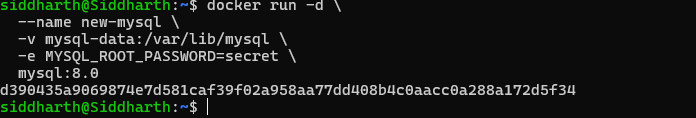
Explanation: The MySQL database stores its data files at /var/lib/mysql inside the container. By mapping this path to the named volume mysql-data, all database files survive container deletion. The second container mounts the same volume and picks up exactly where the first left off.
Example 2 – Nginx with Custom Configuration via Bind Mount
# Create a config directory and a custom nginx configuration
mkdir ~/nginx-config
echo 'server {
  listen 80;
  server_name localhost;
  location / {
    return 200 "Hello from mounted config!";
  }
}' > ~/nginx-config/nginx.conf

# Run nginx mounting the custom config
docker run -d \
  --name nginx-custom \
  -p 8080:80 \
  -v ~/nginx-config/nginx.conf:/etc/nginx/conf.d/default.conf \
  nginx

# Test the custom response
curl http://localhost:8080
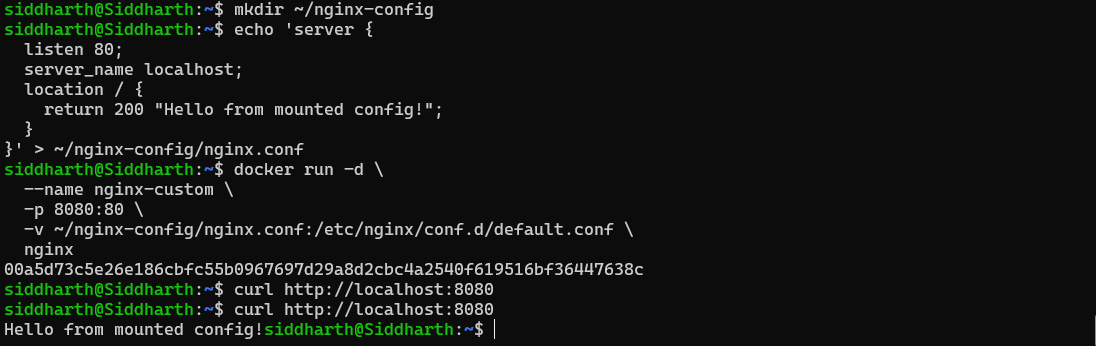
Explanation: Instead of building a custom Docker image with the configuration baked in, we use a bind mount to replace the default nginx config file at runtime. Editing the file on the host immediately changes nginx’s behavior — great for configuration management in dev/staging environments.
Lab 4: Volume Management Commands
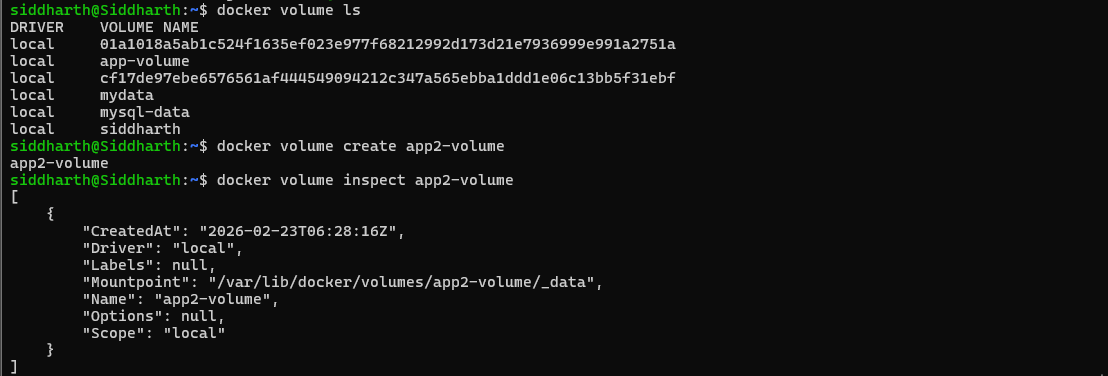
# List all volumes
docker volume ls

# Create a named volume
docker volume create app-volume

# Inspect volume details (driver, mount point, etc.)
docker volume inspect app-volume

# Remove a specific volume
docker volume rm volume-name

# Remove all volumes not in use by any container
docker volume prune

# Copy a file from host into a volume via a running container
docker cp local-file.txt container-name:/path/in/volume
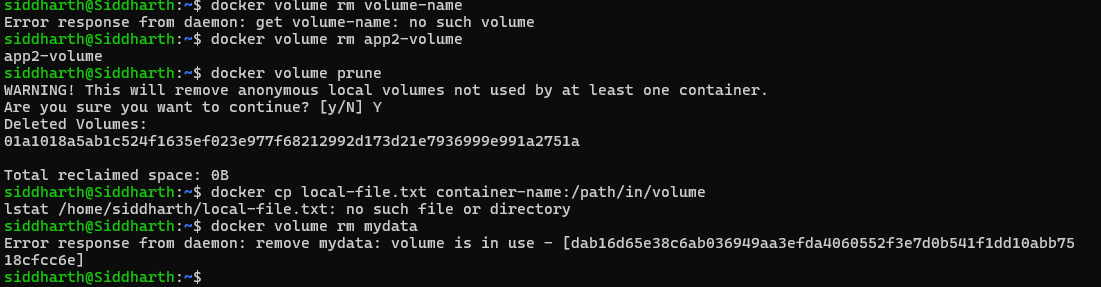
Note: Always back up important volumes before running
docker volume pruneas this action is irreversible.
Part 2: Environment Variables
Lab 1: Setting Environment Variables
Method 1: Using the -e Flag
# Pass a single environment variable
docker run -d \
  --name app1 \
  -e DATABASE_URL="postgres://user:pass@db:5432/mydb" \
  -e DEBUG="true" \
  -p 3000:3000 \
  my-node-app

# Multiple variables in one command
docker run -d \
  -e VAR1=value1 \
  -e VAR2=value2 \
  -e VAR3=value3 \
  my-app
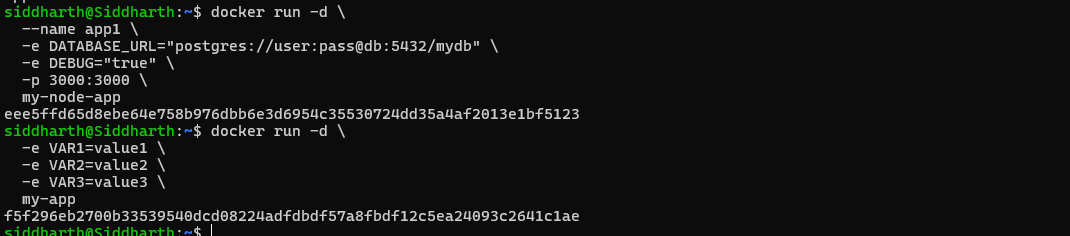
Explanation: The -e flag injects an individual environment variable into the container at startup. The application inside the container can read it using standard OS environment APIs (e.g., os.environ in Python, process.env in Node.js).
Method 2: Using --env-file
# Create a .env file
echo "DATABASE_HOST=localhost" > .env
echo "DATABASE_PORT=5432" >> .env
echo "API_KEY=secret123" >> .env

# Use the env file when starting the container
docker run -d \
  --env-file .env \
  --name app2 \
  my-app

# Multiple env files can be combined
docker run -d \
  --env-file .env \
  --env-file .env.secrets \
  my-app
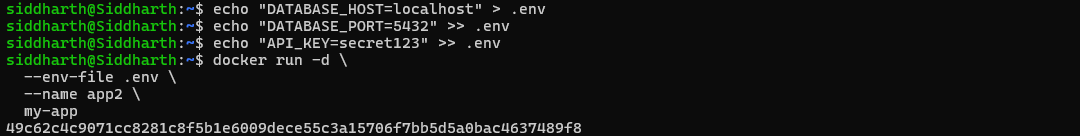
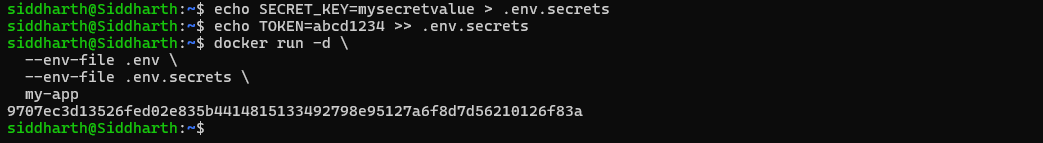
Explanation: The --env-file flag reads all KEY=VALUE pairs from a file and injects them as environment variables. Sensitive credentials like API keys should be stored in .env.secrets and excluded from version control via .gitignore.
Method 3: ENV in Dockerfile
# Dockerfile snippet
ENV NODE_ENV=production
ENV PORT=3000
ENV APP_VERSION=1.0.0
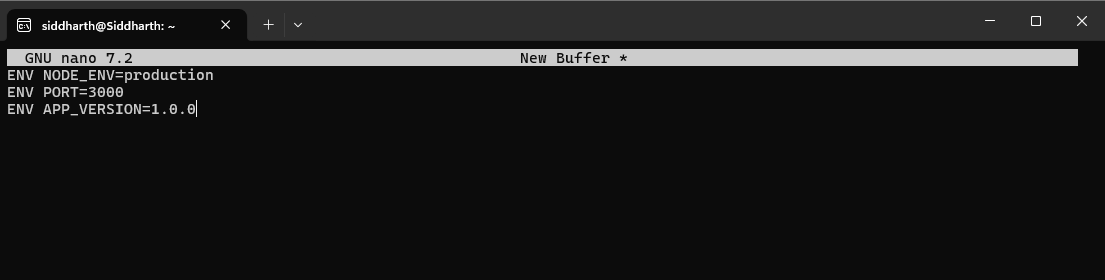
# These defaults can be overridden at runtime:
docker run -e PORT=8080 my-app
Explanation: The ENV instruction in a Dockerfile sets default environment variables baked into the image. These defaults are used unless explicitly overridden by -e or --env-file at runtime. This is ideal for setting sensible production defaults.
Lab 2: Python Flask Application with Environment Variables
app.py — Reading Environment Variables
# app.py
import os
from flask import Flask
app = Flask(__name__)
# Read environment variables with defaults
db_host = os.environ.get('DATABASE_HOST', 'localhost')
debug_mode = os.environ.get('DEBUG', 'false').lower() == 'true'
api_key = os.environ.get('API_KEY')
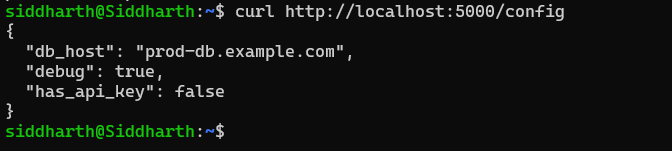
@app.route('/config')
def config():
return {
'db_host': db_host,
'debug': debug_mode,
'has_api_key': bool(api_key)
}
if __name__ == '__main__':
port = int(os.environ.get('PORT', 5000))
app.run(host='0.0.0.0', port=port, debug=debug_mode)
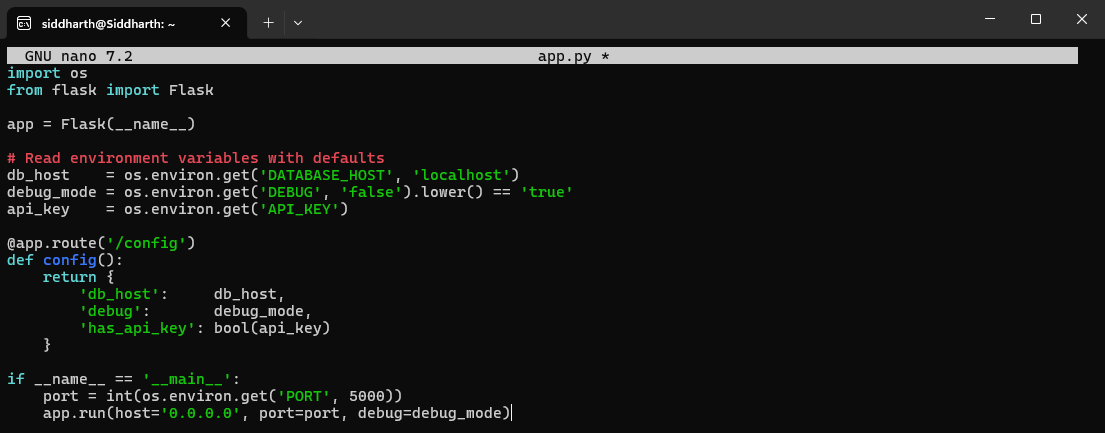
Explanation: os.environ.get(KEY, default) safely retrieves environment variables. If the variable is not set, the default value is used instead of raising an exception. This makes the application portable — it runs correctly in development, staging, and production with only the environment variables changing.
Dockerfile for the Flask App
FROM python:3.9-slim

# Build-time environment variables (affect the build process)
ENV PYTHONUNBUFFERED=1
ENV PYTHONDONTWRITEBYTECODE=1

WORKDIR /app

COPY requirements.txt .
RUN pip install -r requirements.txt

COPY app.py .

# Default runtime environment variables (can be overridden)
ENV PORT=5000
ENV DEBUG=false

EXPOSE 5000
CMD ["python", "app.py"]
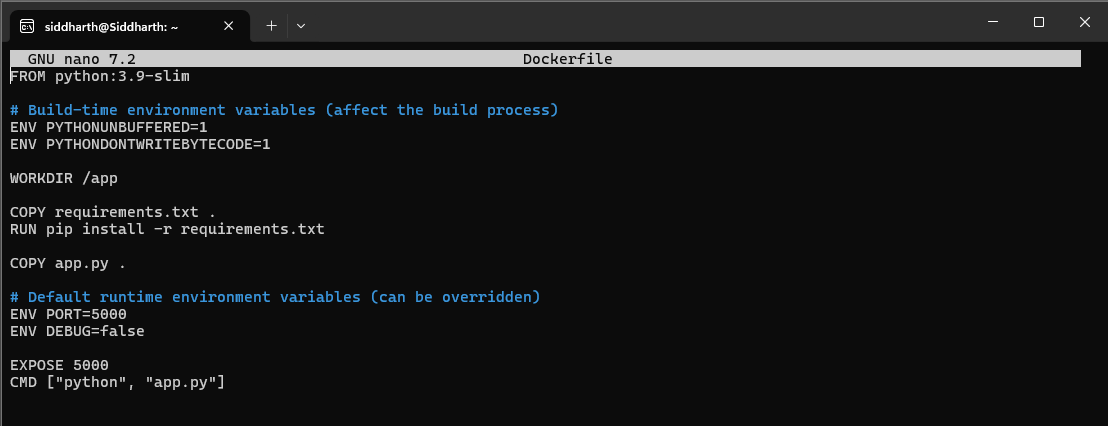
Explanation: PYTHONUNBUFFERED=1 ensures Python output is sent directly to the terminal without buffering, which is critical for real-time log monitoring in Docker. PYTHONDONTWRITEBYTECODE=1 prevents .pyc cache files from being created inside the container image, keeping it clean.
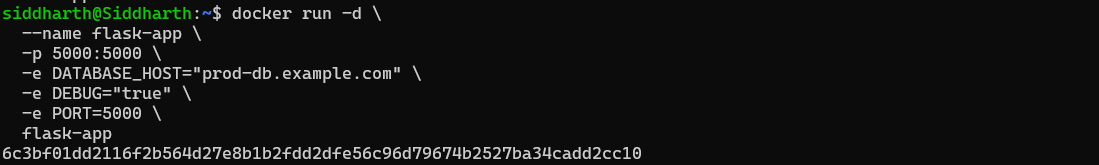
Lab 3: Testing Environment Variables in Containers
# Run the Flask app with custom environment variables
docker run -d \
  --name flask-app \
  -p 5000:5000 \
  -e DATABASE_HOST="prod-db.example.com" \
  -e DEBUG="true" \
  -e PORT="5000" \
  flask-app

# List all environment variables in the running container
docker exec flask-app env

# Print a specific variable
docker exec flask-app printenv DATABASE_HOST

# Test the /config endpoint
curl http://localhost:5000/config
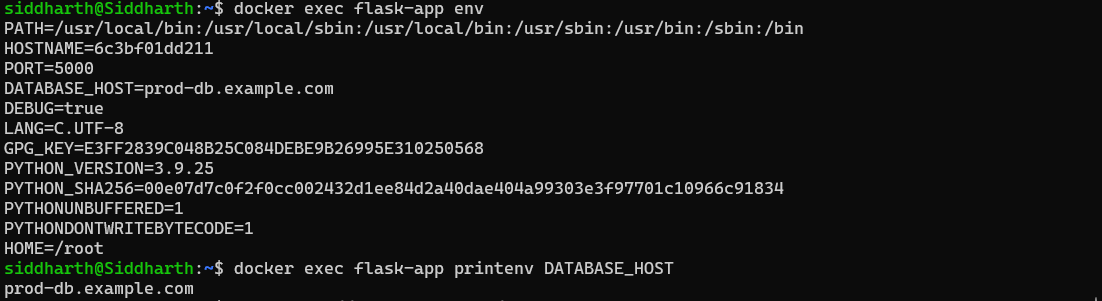
Explanation: docker exec flask-app env prints all environment variables available inside the container process. This is extremely useful for debugging configuration issues — confirming that the correct values are being passed in before troubleshooting application logic.
Part 3: Docker Monitoring
Lab 1: Real-Time Metrics with docker stats
# Live stats for ALL running containers
docker stats

# Live stats for specific containers only
docker stats container1 container2

# Single snapshot (no continuous stream)
docker stats --no-stream

# Custom formatted table output
docker stats --format "table \t\t\t"

# Include stopped containers
docker stats --all

# JSON output (for scripting/automation)
docker stats --format json --no-stream
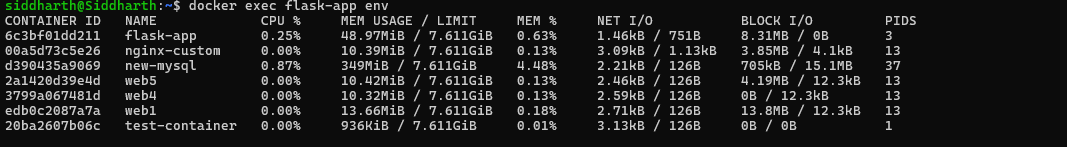

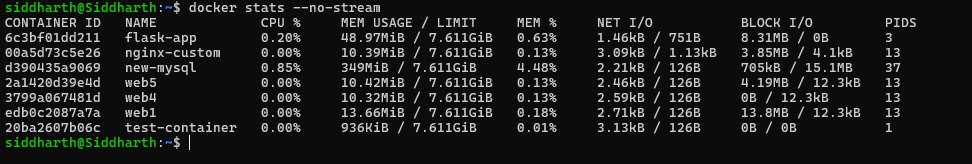
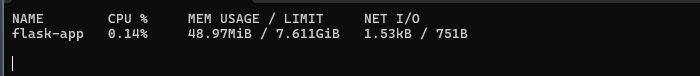
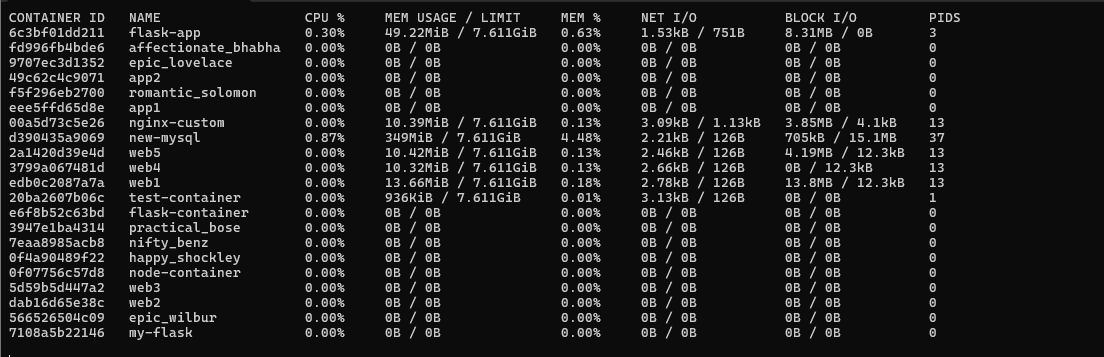
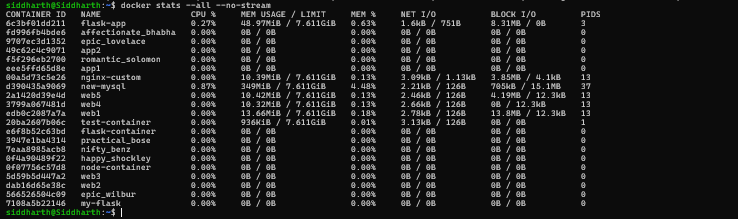
Explanation: docker stats streams live resource usage metrics for containers. CPU % is measured relative to the total CPU capacity of the host (all cores). Memory Usage shows current vs. limit (if set). NetIO shows cumulative bytes sent and received since the container started. This is the first tool to reach for when diagnosing performance degradation.
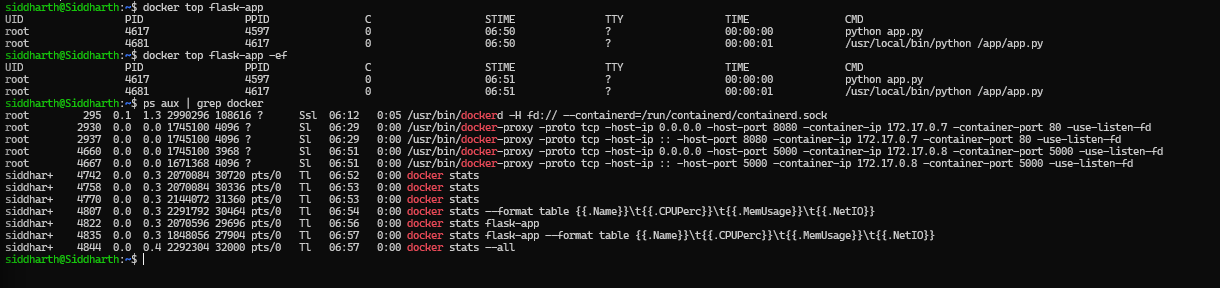
Lab 2: Process Monitoring with docker top
# List all processes running inside the container
docker top container-name

# Show full command-line arguments
docker top container-name -ef

# Compare against host-level Docker processes
ps aux | grep docker
 Explanation:
 docker top is similar to the Unix top or ps commands but scoped to a specific container. It shows all processes running inside the container’s namespace, including PIDs and the commands being executed. Useful for verifying worker processes, detecting runaway jobs, and auditing.
Lab 3: Application Logs with docker logs
# View all logs
docker logs container-name

# Follow logs in real-time (like tail -f)
docker logs -f container-name

# Show only last 100 lines
docker logs --tail 100 container-name

# Include timestamps in log output
docker logs -t container-name

# Logs since a specific date
docker logs --since 2024-01-15 container-name

# Combine: follow, last 50 lines, with timestamps
docker logs -f --tail 50 -t container-name
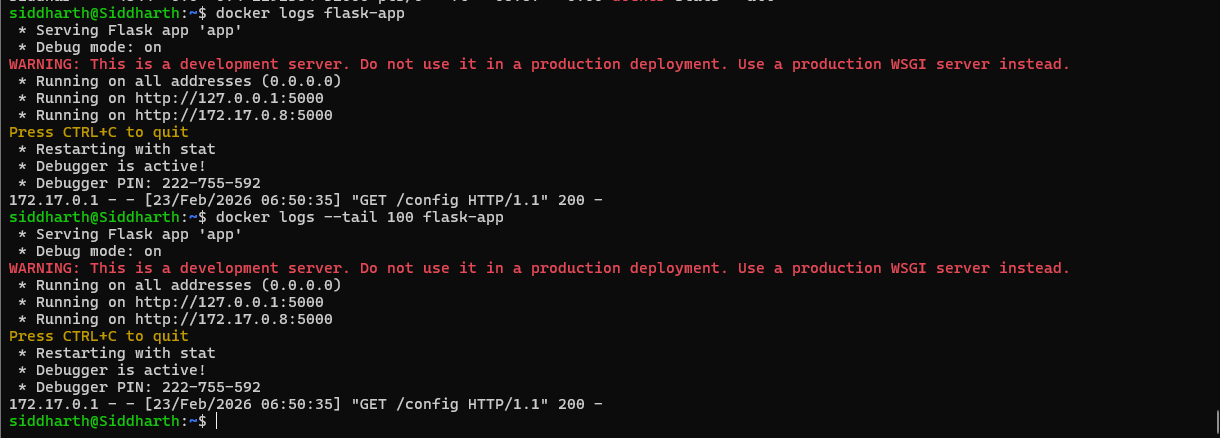
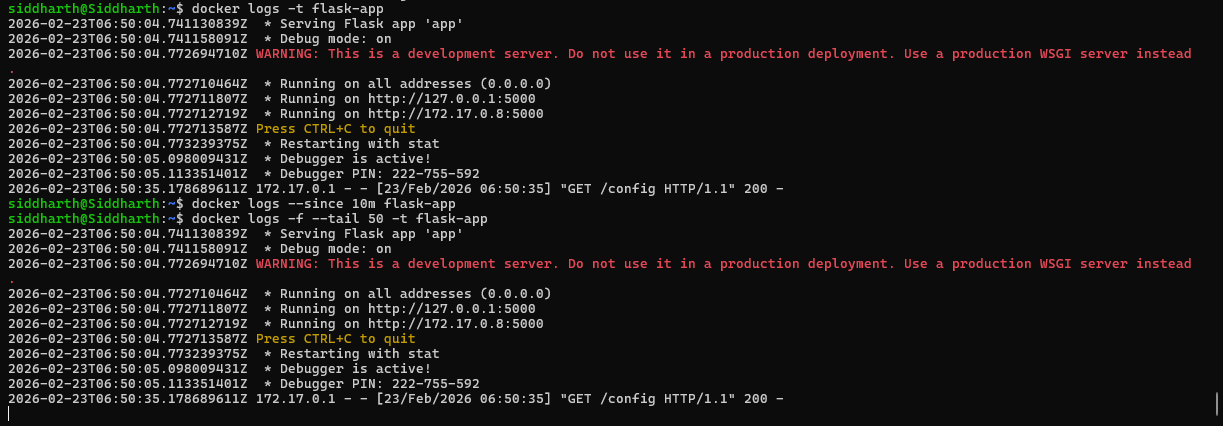
Explanation: Docker captures everything written to stdout and stderr inside a container as log entries. The -f flag streams new log entries as they arrive. --tail limits output to the most recent N lines. Timestamps (-t) are crucial for correlating events across multiple services during incident investigation.
Lab 4: Container Inspection with docker inspect
# Full JSON details about a container
docker inspect container-name

# Get only the container's runtime status
docker inspect --format='' container-name

# Get the container's internal IP address
docker inspect --format='' container-name

# View all environment variables passed to the container
docker inspect --format='' container-name

# Check memory limit (0 = unlimited)
docker inspect --format='' container-name

# Check CPU limit (in nano-CPUs; divide by 1e9 for CPU count)
docker inspect --format='' container-name
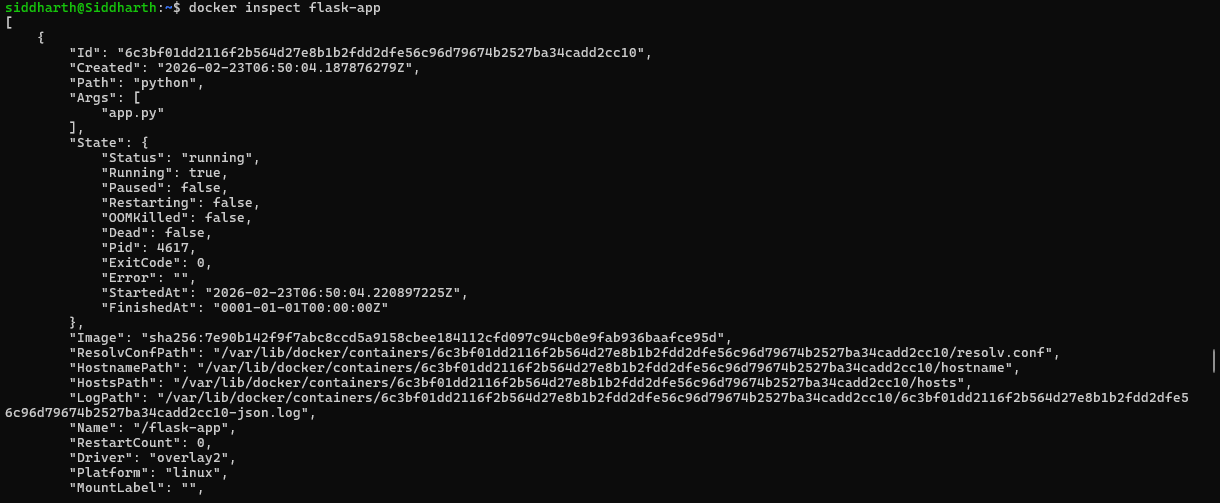
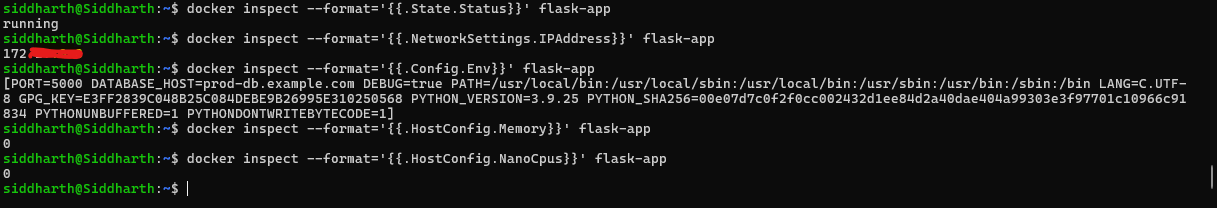
Explanation: docker inspect returns the full configuration of a container as a JSON document. The --format flag uses Go template syntax to extract specific fields without parsing the entire JSON. This is essential for automation scripts and CI/CD pipelines that need to query container configuration programmatically.
Lab 5: Real-Time Event Monitoring with docker events
# Stream all Docker daemon events
docker events

# Filter to only container events
docker events --filter 'type=container'

# Filter for specific lifecycle events
docker events --filter 'event=start'
docker events --filter 'event=die'

# Events since a specific date
docker events --since '2024-01-15'

# Custom formatted output
docker events --format '  '
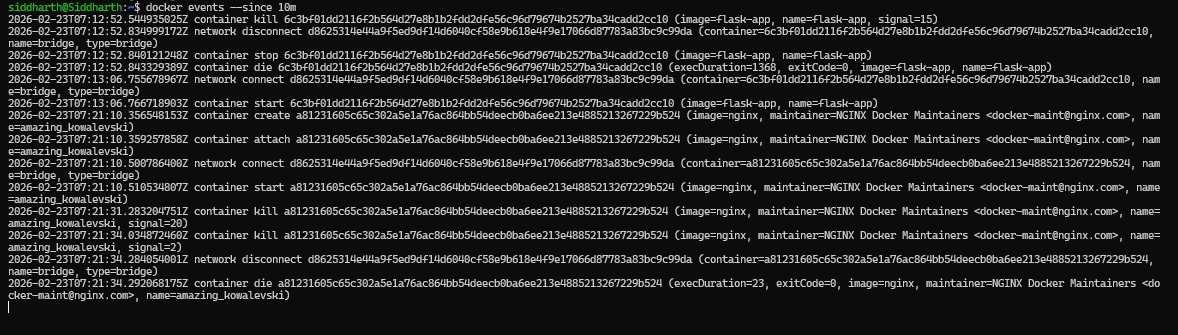
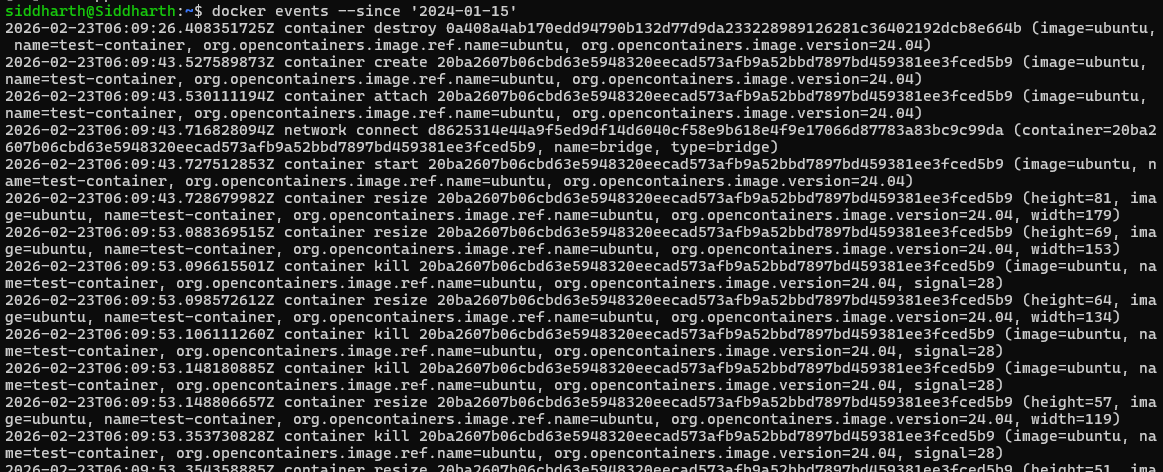
Explanation: docker events listens to the Docker daemon’s event bus and streams lifecycle events such as container start, stop, die, kill, pause, and network connect/disconnect. This is useful for automated alerting systems, health checks, and audit logging.
Lab 6: Monitoring Dashboard Shell Script
#!/bin/bash
# monitor.sh — Simple Docker Monitoring Dashboard

echo "=== Docker Monitoring Dashboard ==="
echo "Time: $(date)"
echo

echo "1. Running Containers:"
docker ps --format "table \t\t"
echo

echo "2. Resource Usage:"
docker stats --no-stream --format "table \t\t\t"
echo

echo "3. Recent Events (last 5 minutes):"
docker events --since '5m' --until '0s' \
  --format '  ' | tail -5
echo

echo "4. Disk Usage:"
docker system df
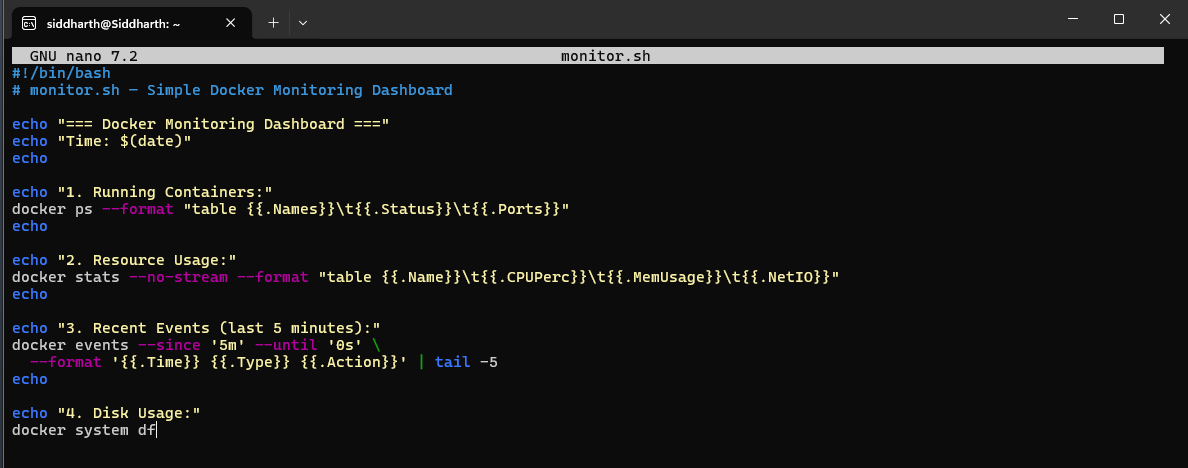
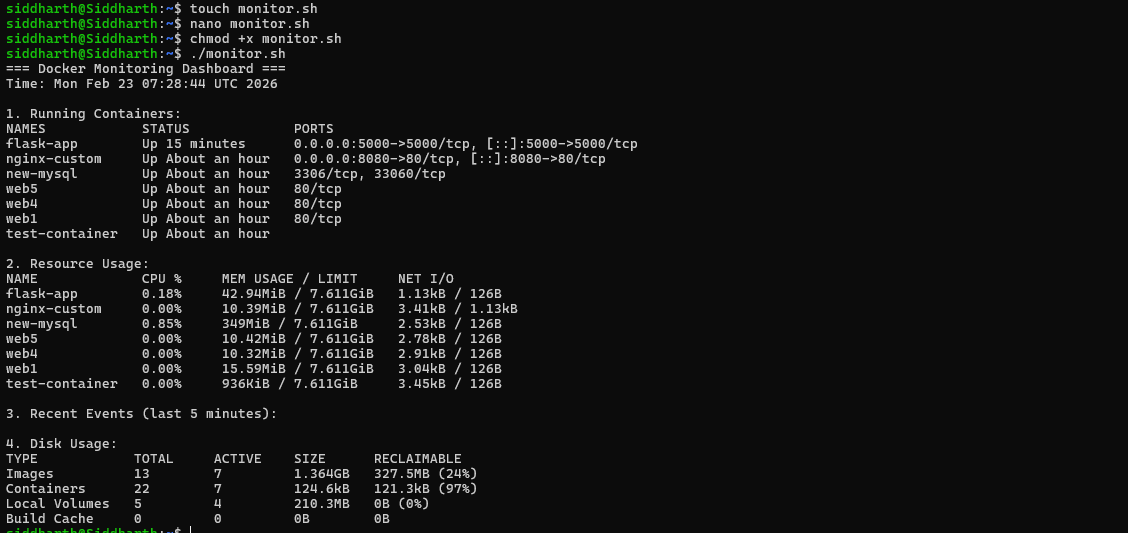
Explanation: This monitoring script combines four key monitoring commands into a single snapshot dashboard. Run it periodically via cron or a monitoring tool to get a quick system-health overview. docker system df shows disk usage by images, containers, and volumes — important for managing storage on production servers.
Part 4: Docker Networks
Lab 1: Listing Default Networks
# View all networks managed by Docker
docker network ls

# Expected output:
# NETWORK ID     NAME      DRIVER    SCOPE
# abc123         bridge    bridge    local
# def456         host      host      local
# ghi789         none      null      local
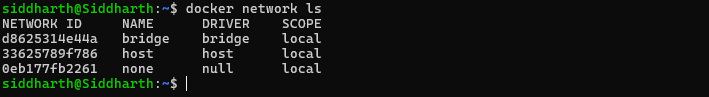
Explanation: Docker creates three default networks at installation: bridge (the default for standalone containers), host (shares the host’s network), and none (no networking). Custom networks should always be created for production multi-container applications.
Lab 2: Network Types in Detail
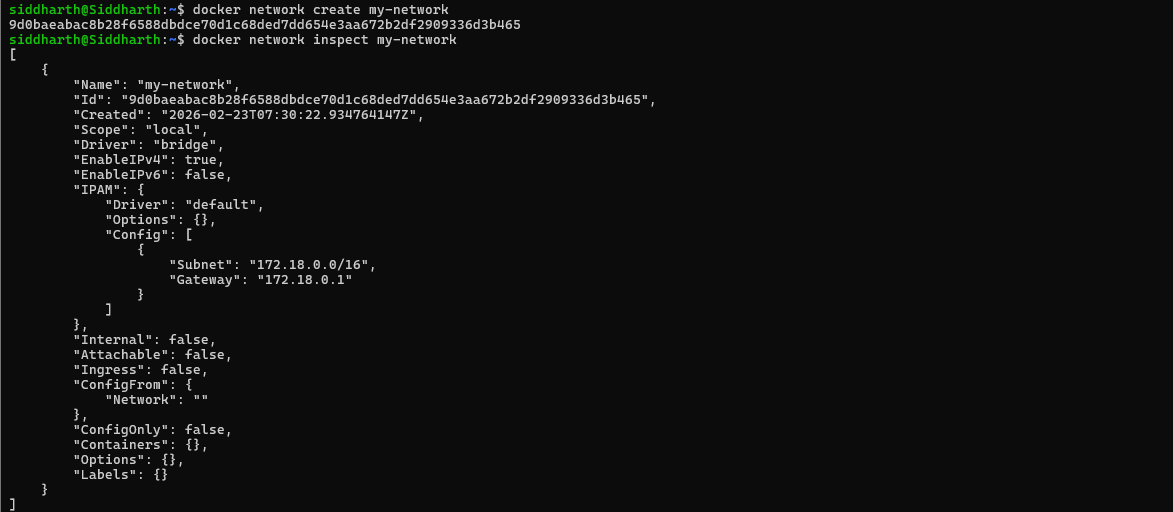
1. Bridge Network (Custom)
# Create a custom bridge network
docker network create my-network

# Inspect the new network
docker network inspect my-network

# Run two containers on the same custom network
docker run -d --name web1 --network my-network nginx
docker run -d --name web2 --network my-network nginx

# Containers can now reach each other by name (Docker DNS)
docker exec web1 curl http://web2
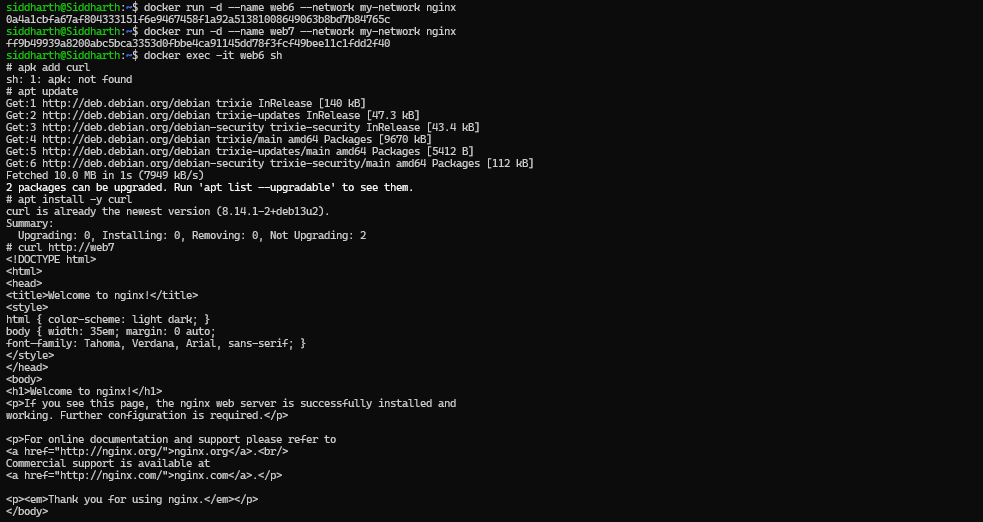
Explanation: Custom bridge networks provide automatic DNS resolution between containers using container names as hostnames. On the default bridge network, containers can only communicate by IP address, which changes on every container restart. Custom networks solve this problem elegantly.
2. Host Network
# Run a container sharing the host's network stack
docker run -d --name host-app --network host nginx

# Access nginx directly on the host's port 80 (no -p needed)
curl http://localhost
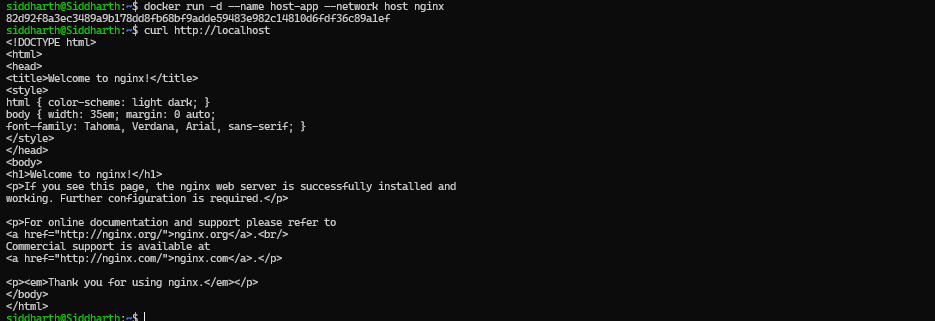
Explanation: With host networking, the container bypasses Docker’s virtual networking and uses the host machine’s interfaces directly. There is no NAT overhead, offering the best network performance. However, there is no isolation — port conflicts with other host services are possible.
3. None Network
# Create a fully isolated container with no network access
docker run -d --name isolated-app --network none alpine sleep 3600

# Verify — only loopback interface exists
docker exec isolated-app ifconfig
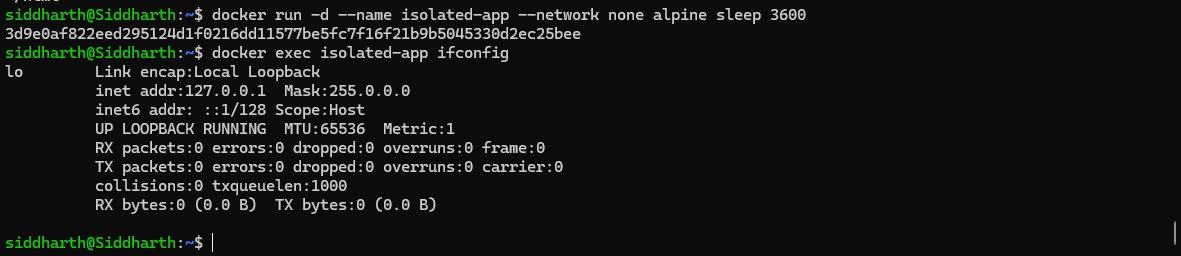
Explanation: The none network driver disables all networking for the container. Only the loopback interface (127.0.0.1) exists. Used for compute-only workloads that process local data and must be prevented from making any external network calls for security reasons.
4. Overlay Network (Docker Swarm)
# Create an overlay network (requires Swarm mode)
docker network create --driver overlay my-overlay
Explanation: Overlay networks span multiple Docker hosts in a Swarm cluster, enabling containers on different physical or virtual machines to communicate as if they were on the same local network. Used in production-scale deployments with Docker Swarm or Kubernetes.
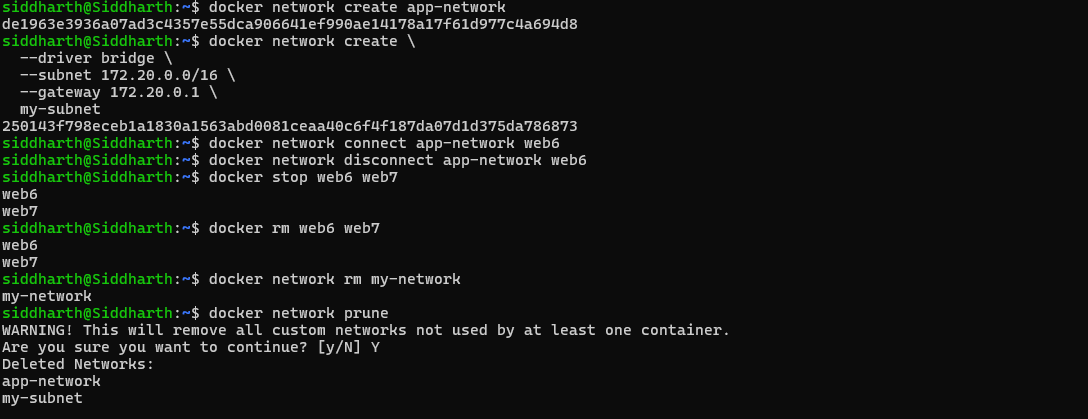
Lab 3: Network Management Commands
# Create a basic bridge network
docker network create app-network

# Create a network with custom subnet and gateway
docker network create \
  --driver bridge \
  --subnet 172.20.0.0/16 \
  --gateway 172.20.0.1 \
  my-subnet

# Connect an already-running container to a network
docker network connect app-network existing-container

# Disconnect a container from a network
docker network disconnect app-network container-name

# Delete a specific network (must have no active containers)
docker network rm network-name

# Remove all unused networks
docker network prune
Lab 4: Multi-Container App — Web App + Database
# Step 1: Create an isolated application network
docker network create app-network

# Step 2: Start PostgreSQL database on the network
docker run -d \
  --name postgres-db \
  --network app-network \
  -e POSTGRES_PASSWORD=secret \
  -v pgdata:/var/lib/postgresql/data \
  postgres:15

# Step 3: Start the web application, connecting via hostname
docker run -d \
  --name web-app \
  --network app-network \
  -p 8080:3000 \
  -e DATABASE_URL="postgres://postgres:secret@postgres-db:5432/mydb" \
  -e DATABASE_HOST="postgres-db" \
  node-app

# The web-app connects to postgres-db using its container
# name as the hostname — Docker DNS resolves it automatically.
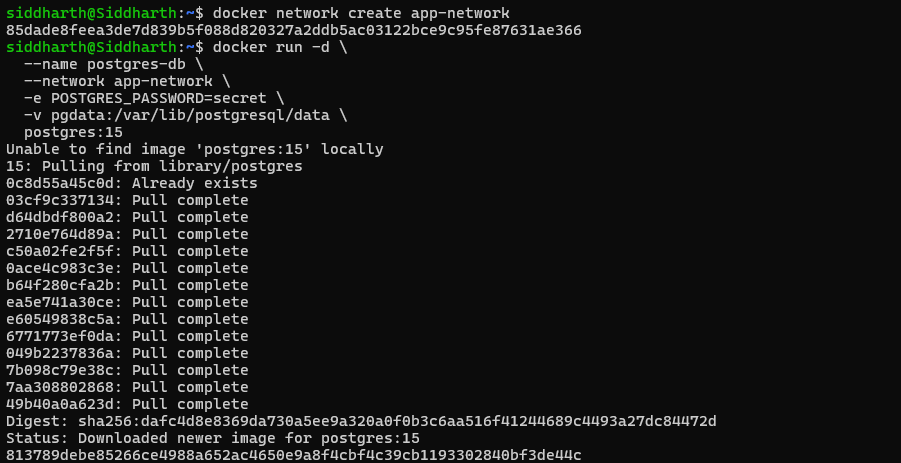
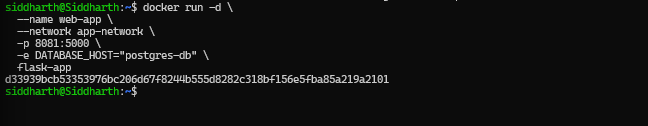
Explanation: Both containers are placed on the same custom bridge network (app-network). Docker’s built-in DNS automatically resolves postgres-db to the database container’s IP address, so the web application can use DATABASE_HOST=postgres-db as a stable hostname regardless of IP changes. The database is NOT exposed externally (no -p flag), ensuring it is only accessible from within the network.
Lab 5: Network Debugging
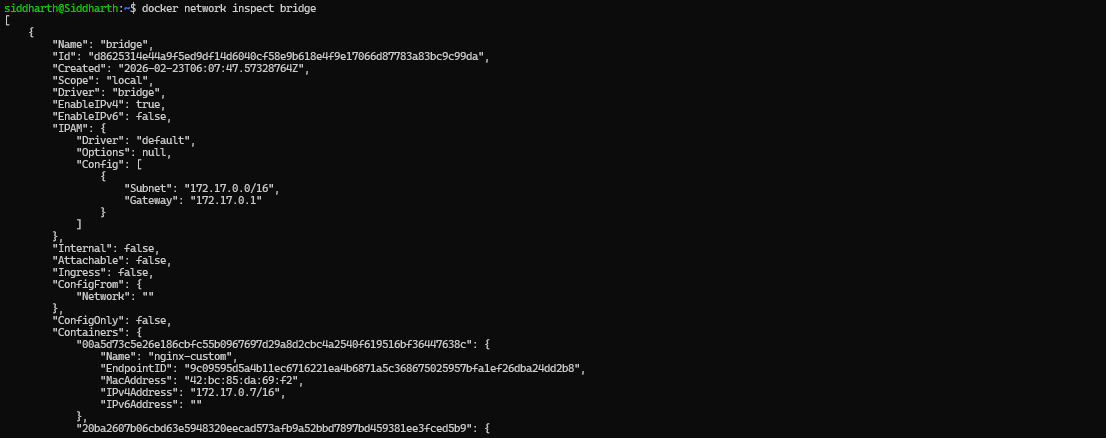
# Inspect network and see all connected containers
docker network inspect bridge
# Get a container's IP address
docker inspect \
--format='' \
container-name
# DNS resolution test between containers
docker exec container-name nslookup another-container
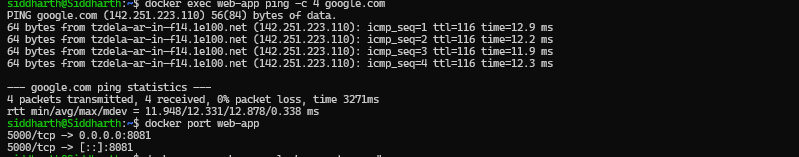
# Ping another container by name
docker exec container-name ping -c 4 google.com
# HTTP connectivity test
docker exec container-name curl -I http://another-container
# View published port mappings
docker port container-name

Lab 6: Port Publishing vs. EXPOSE
# Publish a specific host port to a container port
docker run -d -p 80:8080 --name app1 nginx
# Host port 80 → Container port 8080

# Let Docker assign a random available host port
docker run -d -p 8080 --name app2 nginx

# Publish multiple ports simultaneously
docker run -d -p 80:80 -p 443:443 --name app3 nginx

# Bind only to a specific host IP (security hardening)
docker run -d -p 127.0.0.1:8080:80 --name app4 nginx


Note:
EXPOSEin a Dockerfile is documentation only — it tells humans and tools which port the app uses, but does NOT publish the port. Always use-pat runtime to actually expose a port to the host.
Part 5: Complete Real-World Multi-Container Application
5.1 Architecture
This example deploys a full-stack application with three services communicating over a custom network:
- Flask Web App (port 5000) — application tier
- PostgreSQL Database (port 5432) — persistence tier
- Redis Cache (port 6379) — caching tier
- All services connected via a single custom Docker bridge network
5.2 Deployment Commands
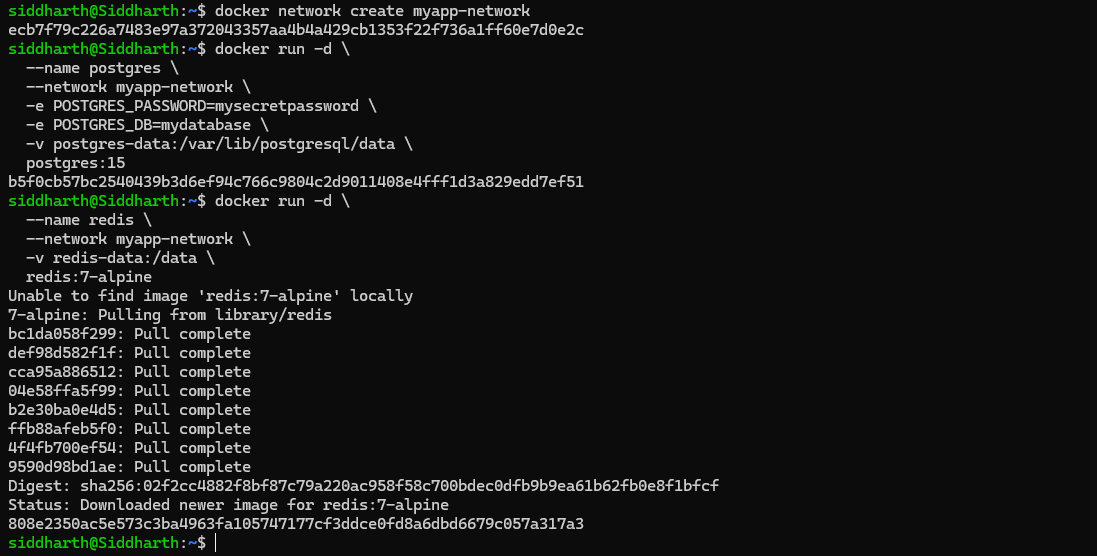
# Step 1: Create the application network
docker network create myapp-network

# Step 2: Start PostgreSQL with a persistent volume
docker run -d \
  --name postgres \
  --network myapp-network \
  -e POSTGRES_PASSWORD=mysecretpassword \
  -e POSTGRES_DB=mydatabase \
  -v postgres-data:/var/lib/postgresql/data \
  postgres:15

# Step 3: Start Redis with a persistent volume
docker run -d \
  --name redis \
  --network myapp-network \
  -v redis-data:/data \
  redis:7-alpine

# Step 4: Start Flask app connecting to both services
docker run -d \
  --name flask-app \
  --network myapp-network \
  -p 5000:5000 \
  -v $(pwd)/app:/app \
  -v app-logs:/var/log/app \
  -e DATABASE_URL="postgresql://postgres:mysecretpassword@postgres:5432/mydatabase" \
  -e REDIS_URL="redis://redis:6379" \
  -e DEBUG="false" \
  -e LOG_LEVEL="INFO" \
  --env-file .env.production \
  flask-app:latest
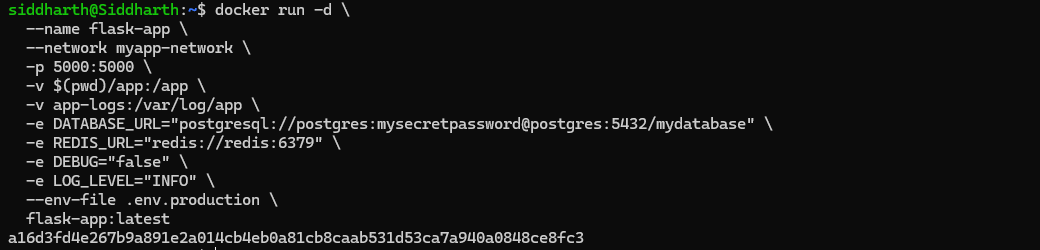
Explanation: The flask-app container references both postgres and redis using their container names as hostnames — this works because all three containers are on the same myapp-network. Database and cache data are stored in named volumes, so they survive container restarts or updates. Application logs are written to a separate named volume for centralized log management.
5.3 Monitoring the Stack
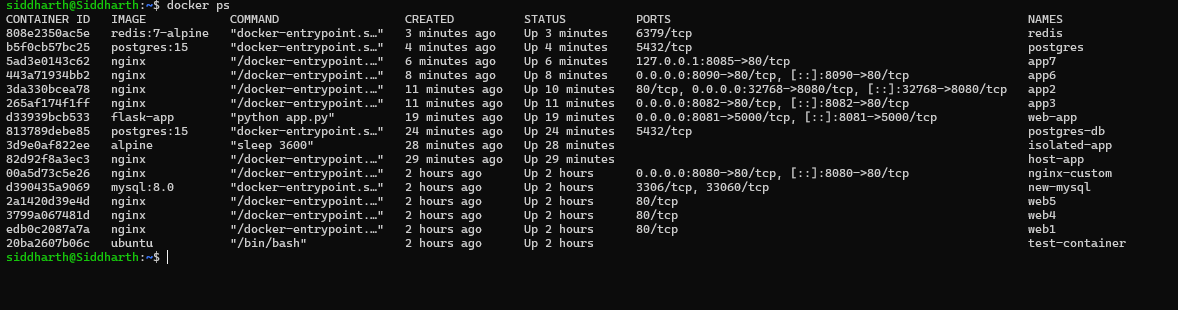
# Check all running containers
docker ps
# Monitor resource usage for all three services simultaneously
docker stats postgres redis flask-app
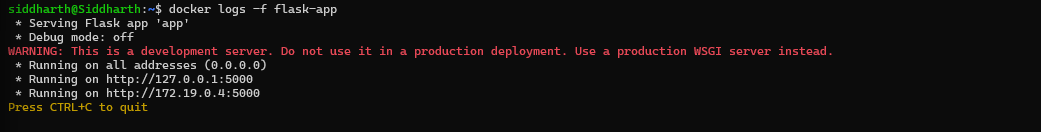
# Tail live logs from the Flask application
docker logs -f flask-app
# Test network connectivity from Flask to PostgreSQL
docker exec flask-app ping -c 2 postgres
# Test network connectivity from Flask to Redis
docker exec flask-app ping -c 2 redis
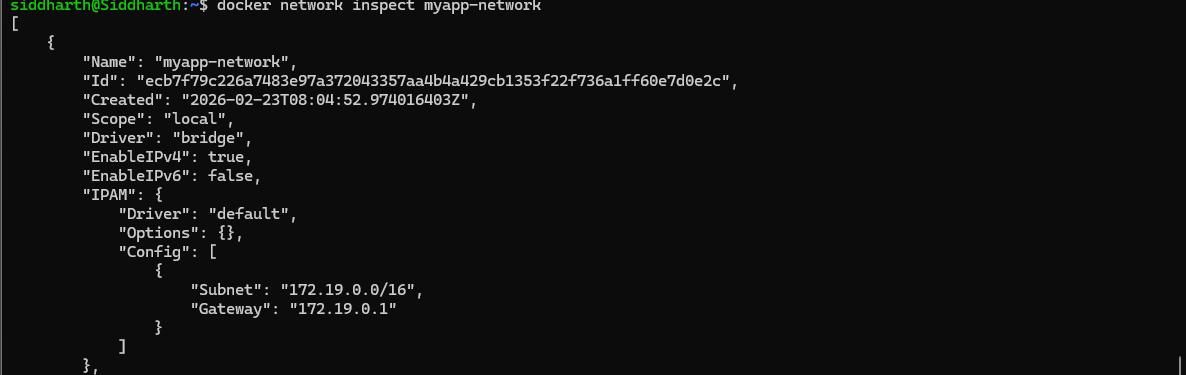
# View full network topology
docker network inspect myapp-network

Quick Reference Cheatsheet
| Category | Key Commands |
|---|---|
| Volumes | docker volume create <name> | docker run -v <vol>:/path | docker volume ls | docker volume prune |
| Env Vars | docker run -e VAR=value | docker run --env-file .env | ENV VAR=value (Dockerfile) |
| Monitoring | docker stats | docker logs -f <c> | docker top <c> | docker inspect <c> | docker events |
| Networks | docker network create <n> | docker run --network <n> | docker network connect | docker network inspect |
| Cleanup | docker stop $(docker ps -aq) | docker rm $(docker ps -aq) | docker volume prune -f | docker network prune -f |
6. Key Takeaways
- Volumes persist data beyond the container lifecycle — always use named volumes for production databases and stateful services.
- Environment variables configure containers dynamically — the same Docker image can run in dev, staging, and production with different configurations.
- Monitoring commands (stats, logs, inspect, events) — are your first line of defense for diagnosing and debugging container issues.
- Custom bridge networks enable secure DNS-based container communication — always prefer them over the default bridge for multi-container apps.
EXPOSEis documentation only — use-pat runtime to actually publish ports to the host.- Store sensitive config in
.envfiles — and exclude them from version control using.gitignore.